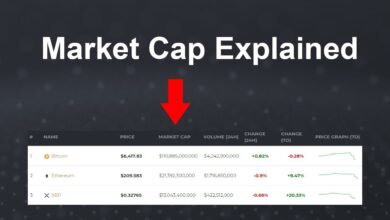
Market Cap Alone Is Risky: 7 Proven Reasons to Look Deeper
Market cap shows how big a company is, not how good it is. Here are 7 reasons to check debt, cash flow, and valuation before you put money in a stock.

Market cap is the first number you see on almost every stock page, and that spot gives it more authority than it has earned. A company worth $500 billion sounds safe. One worth $300 million sounds shaky. Plenty of investors sort their watchlists that way, and plenty of them have paid for it.
Here is the problem. Market cap is a share price multiplied by a share count. It tells you what the market charges for a business today, not whether that business is healthy, cheap, or built to last. Two companies can carry the same market cap and still have completely different debt loads, profit margins, and growth paths. One might be a cash machine. The other might be one bad quarter away from a credit crunch.
None of this makes market cap useless. It is a handy way to gauge size, liquidity, and typical volatility, and it plays a real role in building a portfolio. It just works better as a starting filter than as a decision maker.
This article walks through seven reasons market cap alone is a weak guide for investment decisions, what to check next, and how to fold it into a sensible process. You will see a worked example with two companies, a checklist you can reuse, and the mistakes that trip up beginners and experienced investors alike. If you have ever bought a stock because it was “big” or skipped one because it was “small,” this article is for you.
What Market Cap Actually Measures
Market cap, short for market capitalization, is the total value of a company’s shares on the open market. You get it by multiplying the current share price by the number of shares outstanding. The SEC’s Investor.gov glossary defines it in exactly those terms. Investor.gov
Say a company has 200 million shares outstanding and each one trades at $50. Its market cap is $10 billion. Notice what is missing from that math. Revenue, profit, debt, and competitive strength do not appear anywhere. That total is a live price tag, and it changes every second the market is open.
The Standard Market Cap Size Categories
Brokers and fund companies sort stocks into nano, micro, small, mid, large, and mega-cap groups. The cutoffs vary by provider, though many treat companies above roughly $10 billion as large-cap stocks. These labels work as shorthand. In its guide to market cap, Charles Schwab points out that small-company stocks can swing sharply and often trade in lower volume than larger names. That is useful context, but it is only context. Charles Schwab
Why Investors Lean on Market Cap So Heavily
The metric is easy. It sits on every quote page, it lets you compare companies at a glance, it drives index weights, and it fits neatly into a headline. That convenience explains its popularity, and it is also the trap. A number that is easy to find starts to feel like a number that is complete.
7 Reasons Market Cap Alone Should Not Guide Your Investment
Each reason below points to something market cap leaves out. Taken together, they show why the figure works better as a label than as a verdict.


1. Market Cap Measures Price, Not Business Value
The figure answers one question: what would it cost to buy every share at today’s price? It does not tell you what the business is worth. Rule #1 Investing makes the point that market cap can balloon or deflate on investor sentiment alone, so it captures mood more than fundamentals. Rule #1 Investing
Think about a house. The list price shows what buyers will pay this month. It says nothing about the foundation, the roof, or the mortgage still attached. The same logic applies to stocks. Intrinsic value is what a business can produce for its owners over many years. The total on the screen is what somebody is willing to pay this week.
2. It Ignores Debt and Cash
That figure covers only the equity slice of a company. If you bought the whole business, you would also inherit its debts and gain access to its cash. Medical Economics notes that market cap does not reflect debt at all, even though a company’s capital structure includes both equity and debt. Medical Economics
Here is a quick illustration. Company X and Company Y each have a market cap of $5 billion. Company X carries $3 billion in net debt. Company Y holds $1 billion in net cash. Buying X outright would effectively cost $8 billion, while Y would cost $4 billion. Same headline number, a two-to-one gap in the real price. That gap is why analysts use enterprise value, which is market cap plus debt minus cash.
3. Market Cap Says Nothing About Profits or Cash Flow
A company can be enormous and still lose money. The figure does not care whether a business earns $1 billion or burns $1 billion. A large market cap can rest entirely on hopes for profits that have not shown up yet.
That is why serious investors look at earnings and free cash flow, the cash left over after operating costs and capital spending. Free cash flow pays dividends, funds buybacks, and reduces debt. A business that generates plenty of it has options. A business that does not is depending on investors to keep believing.
4. Investor Sentiment Moves the Number Daily
Nasdaq explains that because investors set the share price, market cap shows perceived value, and that perception can lean on expectations for growth or a new product that may never pan out. When expectations fade, the stock price and the total adjust right along with them. nasdaq
It is possible for a company to lose a third of its market cap over a few weeks while its customers, contracts, and factories stay exactly the same. Judging quality by today’s number is like judging a restaurant by tonight’s crowd. It tells you about tonight.
5. Share Count Changes Can Distort the Picture
Since the total depends on the number of shares, anything that changes the count moves the total. Buybacks shrink the share count. New stock issuance, employee stock awards, and convertible debt increase it and dilute existing owners. The total can shift even when the underlying business has not changed at all.
There is also the matter of free float. The calculation counts every share, including those held by founders, insiders, or governments that rarely trade. The S&P 500, for example, weights companies by float-adjusted market cap for exactly this reason. Westmountfundamentals
And please never confuse share price with size. A company with 4 billion shares at $5 has a market cap of $20 billion. A company with 20 million shares at $500 sits at just $10 billion. The “cheap” stock is the bigger company.
6. A Large Market Cap Does Not Mean a Safe Investment
Size can create false comfort. Big companies fail, stall, and get disrupted. RBC Wealth Management notes that by the end of 2000 the ten largest companies made up about 23 percent of the S&P 500, after peaking near 27 percent earlier that year, and the unwind that followed was sharp. RBC Wealth Management
Large companies also face a math problem. It is much harder to double a $2 trillion business than a $2 billion one. Schwab observes that large-cap securities may not reach the high growth rates some mid-cap and small-cap companies achieve. Safer is not the same as better, and neither one means bulletproof. Charles Schwab
7. Market Cap Weighting Concentrates Index Risk
Most popular benchmarks are each a cap-weighted index, meaning they weight companies by market cap. When a stock rises faster than the rest of the market, its weight rises automatically, which makes the method momentum-following by design. Firstrade
The numbers show how far this has gone. According to RBC Wealth Management, the top ten S&P 500 stocks carried roughly 41 percent of the index weight in 2025 but were expected to produce only about 32 percent of its earnings. In 2015, both figures sat near 19 percent. So if you own an S&P 500 fund, you are more exposed to a handful of names than the “500” suggests. RBC Wealth Management
None of this argues against index funds. Cap weighting has rewarded long-term investors because it lets winners run. It argues for knowing what you actually own, and for remembering that a scheme built on size will always tilt toward whatever has already gone up.
What to Check Alongside Market Cap
Think of market cap as the cover of a book. The checks below are the pages. You do not need all of them for every stock, but you should never skip all of them.
Enterprise Value
Start here. Enterprise value adds debt and subtracts cash from the market cap, giving you a closer estimate of what it would cost to take over the whole company. It also lets you compare firms with very different balance sheets on more equal footing.
Earnings and Free Cash Flow
Check the price-to-earnings ratio, but also look at market cap divided by free cash flow. Look at several years, not one. A single strong year can hide a shaky business, and a single weak year can hide a good one.
Balance Sheet Strength
Look at total debt, interest coverage, and when the debt comes due. A company with heavy debt and a big valuation can look fine until rates rise or sales dip. Strong balance sheets buy time when things go wrong.
Growth and Profitability
Track revenue growth, operating margins, and return on invested capital. You want to see growth that the business can sustain without constantly borrowing or issuing shares.
Valuation Against Peers and History
Sound stock valuation means comparing a company’s multiples with similar businesses and with its own five to ten year range. Comparing across industries usually misleads. A software firm and a utility are valued differently for good reasons, so a straight size comparison between them says very little.
A Worked Example: Two Companies, One Market Cap
These numbers are made up, but the pattern is real. Two companies share the same market cap, and that is where the similarity ends.
| Metric | Company A | Company B |
|---|---|---|
| Market cap | $10 billion | $10 billion |
| Net debt (net cash) | $6 billion | ($2 billion) |
| Enterprise value | $16 billion | $8 billion |
| Annual free cash flow | $200 million | $600 million |
| Market cap divided by free cash flow | 50x | About 16.7x |
| Revenue growth | 15% | 6% |
On market cap alone, A and B look identical. Look closer and Company A costs twice as much once debt is counted, produces a third of the free cash flow, and has far less room for error. Company A may still be worth owning if its growth holds up, since faster growth can justify a higher price. Company B looks steadier and cheaper, though slower. Which one suits you depends on your goals and your patience. But you can only have that conversation once you look past the market cap.
Red Flags Behind an Impressive Market Cap
A big number can hide trouble. These warning signs deserve a closer look whenever a company’s market cap looks better than its results.
- Debt rising faster than earnings. Borrowing can paper over weak performance for a while, but the interest bills do not go away.
- Falling free cash flow alongside rising revenue. Sales growth that never turns into cash is worth questioning.
- Heavy share issuance. If the share count climbs year after year, your slice keeps shrinking, even when the market cap grows.
- A valuation far above peers with no clear reason. A premium needs a story backed by numbers.
- Dependence on one customer or one product. Risk inside the business is something market cap will never flag.
- Steady insider selling. Not every sale is a warning, but a pattern is worth noticing.
None of these signs proves a stock is a bad buy. They simply mean the market cap is telling a rosier story than the financials, and that gap deserves an explanation before you commit money.
How to Use Market Cap the Right Way
None of the above means you should ignore the number. It has real uses when you keep it in its lane.
Use Market Cap to Build a Balanced Portfolio
Schwab notes that diversifying across market caps helps balance risk and growth. Large-cap holdings can anchor a portfolio, while mid-cap and small-cap stocks add growth potential and more volatility. The right mix depends on your time horizon and how well you sleep when prices drop. Charles Schwab
Judge Liquidity and Volatility With It
A smaller company usually means thinner trading, wider gaps between bid and ask prices, and more difficulty getting out of a position quickly. Use limit orders, and size your positions so a bad exit does not hurt.
Use It as a First Filter, Then Do the Homework
Here is a simple process you can repeat:
- Set a market cap range that fits your risk tolerance.
- Convert market cap to enterprise value.
- Read the balance sheet and note any debt due in the next few years.
- Check free cash flow across at least five years.
- Compare valuation multiples with peers and with the company’s own history.
- Decide on a position size based on your conviction and the downside if you are wrong.
Market Cap in Crypto and Micro-Cap Stocks
The limits show up even faster in newer or smaller markets. In crypto, the figure is simply the coin’s price multiplied by its circulating supply, which Shift Markets describes as a simplistic shortcut that skips fundamental analysis. A token with only a small slice of its supply in circulation can post an impressive total that would look very different if more supply reached the market. Shift Markets
Micro-cap stocks bring a different problem. Trading is thin, analyst coverage is sparse, and the price can jump or crater on a handful of trades. If you invest in this corner of the market, plan on doing much more of your own research.
Common Mistakes Investors Make With Market Cap
- Treating market cap as what a company is worth. It is a price, not an appraisal.
- Assuming large means safe. Size lowers some risks and raises others.
- Assuming small means bargain. A low valuation can reflect a weak business.
- Comparing across industries. Different sectors carry different norms for debt, margins, and growth.
- Ignoring share count changes. Dilution can quietly erode your stake.
- Using stale numbers. A figure from last quarter may not resemble today’s.
Market Cap FAQs
Is a higher market cap better?
Not by default. A higher number tells you the company is bigger in the eyes of the market. It does not tell you whether the business is more profitable, better run, or fairly priced.
Is market cap the same as a company’s value?
No. It measures the market price of a company’s equity. Value depends on earnings power, cash flow, debt, and prospects, which market cap does not capture.
Should I only buy large-cap stocks?
You can, but you would give up the growth potential that smaller companies offer and you would still face concentration risk. Many investors hold a blend and adjust it as their goals change.
What should I use alongside it?
Pair it with other tools instead of leaning on it alone. Enterprise value, free cash flow, earnings, and balance sheet strength give you a fuller picture of what you are buying.
Conclusion: Treat Market Cap as a Starting Point
Market cap tells you how the market prices a company’s equity today, and that is useful for judging size, liquidity, and typical volatility, but it leaves out debt, cash, profits, share count changes, and the swings that come from investor mood. Relying on market cap alone can lead you to overpay for indebted businesses, feel safe in fragile giants, and take on concentration risk through cap-weighted funds without noticing. A better habit is to use market cap as a first filter, convert it to enterprise value, check free cash flow and the balance sheet, compare valuations against peers, and build a portfolio that mixes company sizes on purpose. Do that, and the number stops being a verdict and goes back to being what it always was: one useful piece of a bigger picture.