Market Cap Rising: 7 Revealing Signals About Investor Sentiment (and 3 Hidden Warnings)
What a rising total crypto market cap says about investor sentiment, which signals confirm a real shift, and the warning signs that a rally may not last.

Market cap is the number most people glance at to judge the mood of the crypto market. When the total climbs, it feels like confidence is returning. When it falls, it feels like everyone is heading for the exits. That instinct is mostly right, but a rising total can mean very different things depending on what’s driving it.
Late September 2026 is a good example. The total crypto market cap rose from about $2.68 trillion on August 31 to roughly $2.87 trillion by September 25. Over the same stretch, the Crypto Fear and Greed Index swung from fear into greed, touching 78 on September 22 as Bitcoin pushed past $86,000. On the surface, that looks like a clean shift from pessimism to optimism.
Look closer, though, and the picture has layers. Part of the move came from ETF inflows and fresh buying. Part came from short sellers being forced out of their positions. And Bitcoin’s share of the market stayed high, which tells you investors were still playing it relatively safe.
This guide explains what a rising total market cap actually signals about investor sentiment. We’ll cover seven signals that suggest a real change in mood, three warning signs that a rally may be weaker than it looks, and a simple checklist you can use to read the market for yourself.
What Total Market Cap Actually Measures
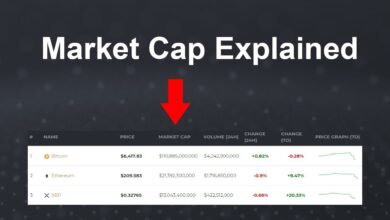
The total crypto market cap is the combined value of every tracked cryptocurrency, calculated by multiplying each coin’s price by its circulating supply and adding the results together. It’s the broadest single number for the size of the crypto market.
Because it’s built from prices, total market cap reacts to the same forces that move prices: demand, supply, news, leverage, and emotion. That’s why it works as a rough sentiment gauge. When investors feel confident, they buy, prices rise, and the total climbs. When they’re afraid, they sell or sit on the sidelines, and the total shrinks.
Why Market Cap Is Only a Proxy for Sentiment
It’s worth being clear about what the number can’t tell you:
- It isn’t cash invested. Market cap values every coin at the latest trade price. A small amount of buying in a thin market can lift market cap by far more than the dollars that changed hands.
- It mixes very different assets. Bitcoin, stablecoins, memecoins, and new tokens all sit in the same total, even though they attract very different kinds of investors.
- It includes stablecoins. Stablecoins are designed to hold a steady price, so when their supply grows, total market cap rises even if no volatile asset moved at all.
- It can be pushed by leverage. Forced buying from short liquidations can lift prices quickly without any real change in long-term confidence.
So a rising market cap is a starting clue, not a verdict. The rest of this guide is about how to tell which kind of rise you’re looking at.
Where the Total Crypto Market Cap Stands in 2026
To see how market cap and sentiment move together, it helps to look at the path the market has taken over the past year.


| Period | Total market cap (approx.) | Market mood |
|---|---|---|
| October 2025 | Above $4 trillion | Euphoria as Bitcoin hit a record near $126,000 |
| First half of 2026 | Falling steadily | Some of the most fearful sentiment readings in years |
| July 1, 2026 | Near the cycle low | Bitcoin hits about $58,000, a 21-month low |
| August 31, 2026 | About $2.68 trillion | Cautious recovery, ETF money returning |
| September 25, 2026 | About $2.87 trillion | Greed, with the index in the 70s |
The recovery from summer is real, but it’s worth keeping in perspective. The total is still well below its late 2025 peak, and Bitcoin remains about a third below its record high. That puts the market in a recovery phase rather than a fresh bull run, which matters when you interpret what today’s rising market cap is telling you.
The Sentiment Swing in Numbers
The mood shift in September was sharp. According to CoinStats data, the Crypto Fear and Greed Index read 43, in fear territory, in mid-September. A week later it was in the 70s. Coinglass data shows the index at 75 on September 26, with a seven-day average of 73 and a 30-day average of 66. You can track the index yourself on the Alternative.me Crypto Fear and Greed Index, one of the longest-running versions.
In other words, total market cap rose around 7% over about four weeks while measured sentiment jumped roughly 30 points. That gap is a good reminder that sentiment tends to move faster and further than prices.
7 Signals a Rising Market Cap Sends About Investor Sentiment
When the total crypto market cap climbs, these are the signals worth reading. The more of them that line up, the more likely it is that sentiment has genuinely improved.
1. Risk Appetite Is Coming Back
The most basic message of a rising market cap is that investors are willing to take on risk again. Crypto is one of the most volatile asset classes, so money flowing in usually means people feel comfortable enough to accept big swings in exchange for potential gains.
In September 2026, that shift showed up clearly. Bitcoin pushed from around $75,000 near the Federal Reserve’s rate hike to an eight-month high of about $87,374 a week later, and the Fear and Greed Index moved from fear to greed. A market that can climb right after a rate hike is a market where risk appetite is recovering.
2. New Money Is Entering, Not Just Old Money Rotating
A healthy rise in market cap usually comes with fresh capital. Two of the clearest places to see that are ETF flows and stablecoin supply.
- ETF inflows. After seven months of outflows earlier in 2026, U.S. spot Bitcoin ETFs took in about $3.52 billion in August, the strongest month of the year. By late September they had turned net positive for the month despite a mid-month dip.
- Stablecoin supply. Total stablecoin market cap stayed above $320 billion through the quarter, near record levels. Stablecoins act as dry powder. A large supply means plenty of cash is parked inside crypto, ready to buy.
When market cap rises alongside ETF inflows and a steady or growing stablecoin base, it’s a sign that new buyers are showing up rather than existing holders simply trading coins back and forth.
3. Where the Growth Happens Reveals the Mood
A rising total can be led by Bitcoin, by large altcoins, or by small speculative tokens. Each tells a different story.
Bitcoin dominance, Bitcoin’s share of total market cap, is the simplest way to check. In late September 2026 it stood at about 58.5%. That’s high by historical standards and suggests investors are still favoring the most established asset.
Here’s a rough guide to reading it:
| What’s rising | Bitcoin dominance | What it suggests about sentiment |
|---|---|---|
| Mostly Bitcoin | Rising | Cautious optimism, investors want safety first |
| Bitcoin and large altcoins together | Flat | Broadening confidence |
| Small and mid-cap altcoins | Falling | Strong risk appetite, sometimes speculative |
| Stablecoins only | Falling | Fear, investors moving to cash inside crypto |
Right now, the market sits somewhere between the first two rows. Confidence is returning, but investors aren’t yet rushing into the riskiest corners.
4. Breadth Shows How Widespread the Optimism Is
A strong rally usually lifts many assets, not just one or two. If the total market cap rises but only a handful of coins are driving it, sentiment is narrower than the headline suggests.
September 2026 showed some signs of breadth. Solana rose more than 50% from its mid-August low, Ethereum added close to $100 billion, and Zcash surged into the top 10. But breadth was uneven. Many smaller tokens lagged, and Bitcoin’s high dominance shows the rally was still concentrated in the largest assets.
5. Rising Volume Confirms the Move
Price moves on low volume are easy to reverse. Price moves on high volume carry more weight, because they show many participants agreeing on a new price level.
When total market cap climbs alongside rising spot trading volume, it suggests genuine demand. When it climbs while volume stays flat or falls, it may simply reflect a lack of sellers, which can flip quickly.
6. Institutions Are Paying Attention Again
In today’s market, institutional flows often lead retail sentiment. Spot ETFs, corporate treasuries, and regulated funds give large investors an easy way in, and their activity tends to show up in the data before social media catches on.
The launch of new products can also lift sentiment for specific assets. Grayscale’s spot Zcash ETF, launched on August 25, 2026, helped push Zcash from the $400s to above $1,600 within a month. When new institutional products keep appearing during a rally, it’s a sign that professional investors see lasting demand.
7. The Market Shrugs Off Bad News
One of the strongest sentiment signals is how the market reacts to bad headlines. In a fearful market, bad news triggers sharp sell-offs. In a confident one, it barely registers.
Mid-September 2026 offered a clear test. On September 15, the Clarity Act failed a key Senate vote. The next day, the Fed raised rates for the first time since 2023. Bitcoin dipped only about 1% on the Clarity news and was back above $80,000 within two days of the rate hike. The total market cap rose in the week that followed. That kind of resilience usually means buyers are waiting to step in on dips.
3 Hidden Warnings Behind a Rising Market Cap
Not every rise is a healthy one. Here are three warning signs that a climbing market cap may be telling a less comfortable story.
Warning 1: The Rally Is Driven by Leverage and Short Squeezes
Crypto markets use a lot of leverage through futures and perpetual contracts. When prices rise quickly, traders betting against the market can be forced to buy back their positions, which pushes prices even higher. This is called a short squeeze.
Part of September’s move fit that pattern. Bitcoin’s climb toward $85,000 included a short squeeze worth about $648 million. Then, after Bitcoin was rejected near $87,000, more than $400 million in long positions were liquidated, pulling the total market cap back below $3 trillion. Moves driven by liquidations can reverse just as fast as they start, because they reflect forced trades rather than lasting conviction.
Warning 2: Greed Readings Get Too Hot
The Fear and Greed Index hit 78, extreme greed, on September 22, 2026. High readings aren’t a sell signal on their own. Markets can stay greedy for weeks during strong uptrends. But extreme greed means many investors are already positioned for gains, which leaves fewer new buyers to push prices higher and more people ready to sell if the mood turns.
It’s also worth remembering that different indexes can disagree. On the same September 26 when Coinglass showed a reading of 75, the CFGI index showed just 56, or neutral. Sentiment tools use different inputs, so no single number tells the full story.
Warning 3: Market Cap Is Rising in Thin or Speculative Corners
If the total market cap is being lifted by a few small tokens with low trading volume or large locked supplies, the headline number can overstate how much real money is flowing in. Mark-to-market math can inflate valuations quickly when only a small share of a token’s supply actually trades.
Watch for rallies led by newly launched tokens, memecoins, or assets with heavy futures open interest. Analysts flagged exactly this risk around Zcash in September, noting that heavy leverage could unwind quickly if momentum faded.
Lessons From Past Market Cap Cycles
History doesn’t repeat exactly in crypto, but past market cap cycles show how value and sentiment tend to move together.
Late 2017: Euphoria at the Top
In December 2017, total crypto market cap soared as retail investors piled in during the ICO boom. Sentiment was extremely greedy, altcoins were rising faster than Bitcoin, and Bitcoin dominance fell sharply. Within weeks, the market peaked and began a long decline. The lesson: when market cap rises fastest in the most speculative assets and dominance collapses, greed is usually close to a peak.
Late 2021: A Broad Rally Before the Turn
In November 2021, total market cap reached a record as Bitcoin, Ethereum, and a wide range of altcoins all rallied. Sentiment stayed greedy for months. When rising interest rates hit in 2022, market cap fell by roughly 70%. The lesson: even a broad, well-supported market cap rally can reverse when the macro backdrop changes.
2025 to 2026: Institutions Change the Pattern
The run to Bitcoin’s October 2025 record, which lifted total market cap above $4 trillion, was led more by ETFs and institutions than by retail speculation. The decline that followed was steep, but the recovery in late summer 2026 again started with ETF inflows. The lesson: in today’s market, institutional flows are often the first place a change in sentiment shows up.
How to Read Total Market Cap and Sentiment Yourself
You don’t need expensive tools to judge whether a rising market cap reflects real confidence. Here’s a simple routine:
- Check total market cap and its trend. Look at the weekly and monthly direction, not just today’s number.
- Check Bitcoin dominance. Rising dominance with a rising total market cap signals cautious optimism. Falling dominance signals growing risk appetite.
- Look at stablecoin supply. A steady or growing stablecoin market cap means cash is available inside crypto to keep buying.
- Watch spot ETF flows. Consistent inflows point to lasting institutional demand.
- Compare with trading volume. Rising market cap on rising volume is stronger than a rise on thin trading.
- Check the Fear and Greed Index. Use more than one version, such as the CoinMarketCap Fear and Greed Index, and focus on extremes rather than daily changes.
- Scan liquidation data. Large short squeezes or long liquidations can distort short-term moves.
- Test the market’s reaction to news. A market that shrugs off bad headlines is usually on firmer footing.
Quick Reference: What Each Indicator Signals
| Indicator | Bullish sentiment signal | Warning signal |
|---|---|---|
| Total market cap | Steady rise over weeks | Sharp spike in days |
| Bitcoin dominance | Stable while total rises | Collapsing during a frenzy |
| Stablecoin supply | Growing alongside prices | Shrinking as money leaves crypto |
| ETF flows | Consistent inflows | Large, repeated outflows |
| Trading volume | Rising with prices | Falling while prices rise |
| Fear and Greed Index | Moving from fear to neutral or greed | Stuck in extreme greed |
| Liquidations | Modest and balanced | Huge short squeezes driving the move |
No single row gives a complete market cap picture. The most reliable reads come when several indicators agree.
This article is for information only and isn’t financial advice. Crypto is highly volatile, so never invest more than you can afford to lose.
Common Mistakes When Reading Market Sentiment
Even experienced investors misread sentiment signals. Watch out for these traps:
- Reacting to a single day. One big green candle doesn’t mean the mood has changed. Look for trends that hold over weeks.
- Trusting one index. Different Fear and Greed tools use different inputs and can disagree by 20 points or more on the same day.
- Ignoring the macro backdrop. Interest rates, inflation data, and oil prices all affect crypto. A rally that ignores a tightening Fed may be fragile.
- Confusing headlines with data. Social media excitement often peaks after prices have already moved. Flows and volume usually tell you more.
- Chasing the crowd at extremes. Buying heavily when greed is highest, or selling everything when fear peaks, tends to lock in the worst prices.
- Forgetting about stablecoins. Growth in stablecoin supply lifts the total market cap without any change in the price of volatile coins.
The best sentiment reads come from combining several data points and giving them time to confirm each other.
Frequently Asked Questions
Does a rising total crypto market cap always mean investors are bullish?
Not always. It usually signals improving sentiment, but it can also reflect short squeezes, stablecoin growth, or speculation in thinly traded tokens. Checking volume, dominance, and flows helps separate real optimism from temporary moves.
How is total market cap different from Bitcoin’s market cap?
Bitcoin’s market cap is the value of Bitcoin alone. Total market cap adds up every tracked cryptocurrency, including Bitcoin, Ethereum, altcoins, and stablecoins. In late September 2026, Bitcoin made up about 58.5% of the total.
What is a good sign that a market cap rally will last?
Market cap rallies tend to hold up better when they come with steady ETF inflows, rising trading volume, broad participation across many coins, and a market that absorbs bad news without falling sharply.
Is extreme greed a sell signal?
Not by itself. Markets can stay in extreme greed for weeks during strong uptrends. It’s better read as a sign that risk is rising and that many investors are already positioned for gains.
Where can I track total crypto market cap?
Major data sites such as CoinMarketCap, CoinGecko, and CoinDesk publish total market cap in real time, along with Bitcoin dominance and other sentiment tools.
Conclusion
A rising total market cap is one of the clearest signs that investor sentiment is improving, as the move from about $2.68 trillion to $2.87 trillion in September 2026 showed alongside a jump in the Fear and Greed Index from fear to greed, but the number only tells part of the story: the strongest signals come when rising market cap lines up with fresh ETF inflows, a healthy stablecoin supply, rising volume, broadening participation, and a market that shrugs off bad news, while leverage-driven short squeezes, extreme greed readings, and rallies in thin speculative corners are warning signs that optimism may be running ahead of reality, so the smart approach is to read market cap together with dominance, flows, volume, and sentiment indexes rather than treating any one number as a final answer, and give those signals time to confirm each other before acting.