Market Cap Explained for Beginners: A Simple, Powerful Guide to 5 Cap Sizes
Market cap explained in plain terms, covering how it's calculated, why it matters, and how to use it when comparing stocks or crypto.
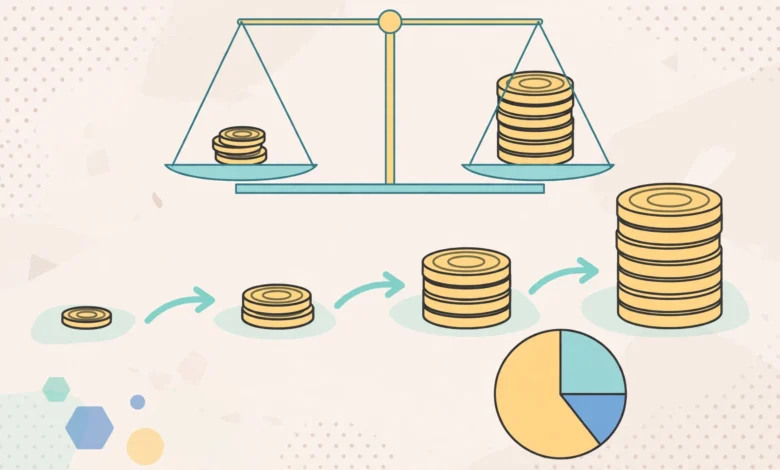
Market cap explained simply enough: it’s the number you get when you multiply what one share (or one coin) is worth by how many exist. That’s it. No advanced math, no hidden formula. But despite being one of the easiest calculations in investing, market cap gets misunderstood constantly, especially by people just starting out.
You’ll see it everywhere. News headlines say a company “added $50 billion in market cap” after an earnings report. Investing apps sort companies into categories like large-cap and small-cap. Crypto exchanges rank coins by the same metric. And yet a lot of beginners nod along without really knowing what the number represents or why anyone should care about it.
This guide breaks market cap down from the ground up. You’ll learn exactly how it’s calculated, what the different size categories mean, why market cap isn’t the same thing as a company’s actual worth, and how the concept applies a little differently once you cross over into crypto. By the end, you’ll be able to look at any market cap figure, whether it’s for Apple, a small biotech firm, or a newly listed cryptocurrency, and understand what it’s actually telling you.
What Is Market Cap?
Market cap, short for market capitalization, is the total value of all of a company’s outstanding shares, based on the current share price. It’s a snapshot of what the market collectively thinks a company is worth at this exact moment, based purely on its stock price and share count.
The formula is straightforward:
Market Cap = Current Share Price × Total Shares Outstanding
So if a company’s stock trades at $50 and there are 10 million shares outstanding, the market cap is $500 million. That number changes constantly, because stock prices move throughout every trading day, and the share count itself can change when a company issues new shares or buys back existing ones.
According to FINRA’s investor education resources, this same basic formula is used to sort companies into size categories that investors and index providers rely on constantly, from major stock indexes down to individual portfolio decisions.
Why Market Cap Isn’t the Same as Company Value
This is where a lot of beginners get tripped up. Market cap measures what investors are currently willing to pay for the company’s shares, not the company’s actual assets, debt, or cash flow. Two companies can have identical market caps and completely different financial health underneath. One might be debt-free with strong cash reserves. The other might be carrying significant debt that isn’t reflected in the market cap number at all.


That’s why more experienced investors often look at a related but different metric called enterprise value, which adds a company’s debt and subtracts its cash from market cap to get a fuller picture. Market cap is a useful starting point, but it’s not the whole story.
How to Calculate Market Cap Step by Step
Even though the formula is simple, it helps to walk through it with a concrete example.
- Find the current share price. This is publicly available on any stock quote page or investing app, updated in real time during market hours.
- Find the number of shares outstanding. This figure is reported in a company’s financial filings and is usually listed right alongside the share price on most investing platforms.
- Multiply the two numbers together. The result is the company’s market cap at that moment.
For example, using a real comparison: if a company’s shares trade around $900 and it has roughly 450 million shares outstanding, multiplying those together produces a market cap in the neighborhood of $400 billion. That single number instantly tells you this is one of the largest publicly traded companies in the world, without needing to look at anything else.
The 5 Main Market Cap Categories
Once you understand how market cap is calculated, the next useful step is understanding how companies get grouped by size. Most investing platforms and financial media use five broad categories.
1. Mega-Cap
Mega-cap companies have market caps above $200 billion. These are the largest, most dominant businesses in the world, the kind that show up constantly in the news and carry outsized influence over major stock indexes. Companies like Apple, Microsoft, and Amazon fall into this group.
2. Large-Cap
Large-cap companies typically have market caps between $10 billion and $200 billion. These are well-established businesses with long track records, often household names, though not quite at the scale of the mega-cap giants. Large-cap stocks are generally considered a foundation for long-term, lower-volatility investing.
3. Mid-Cap
Mid-cap companies fall between $2 billion and $10 billion in market cap. This is often described as a sweet spot for investors seeking a balance between growth potential and stability. Mid-cap companies are usually past the riskiest early stages of growth but haven’t yet reached the size and market dominance of large-cap peers.
4. Small-Cap
Small-cap companies sit between roughly $250 million and $2 billion in market cap. They tend to carry more volatility and risk than larger companies, but also more room for rapid growth. Many small-cap stocks are newer companies or businesses operating in niche industries that haven’t yet scaled up.
5. Micro-Cap
Micro-cap companies fall below $250 million in market cap. These are typically very young, early-stage, or niche businesses with thin trading volume. Micro-cap stocks carry the highest risk of the group, along with the highest potential for both gains and losses.
Here’s a quick reference table for these categories:
| Category | Approximate Market Cap Range |
|---|---|
| Mega-Cap | Above $200 billion |
| Large-Cap | $10 billion – $200 billion |
| Mid-Cap | $2 billion – $10 billion |
| Small-Cap | $250 million – $2 billion |
| Micro-Cap | Below $250 million |
It’s worth noting these thresholds aren’t fixed by law or a single governing body. Different brokerages and index providers draw the lines slightly differently, so treat these ranges as general guidelines rather than exact cutoffs.
Why Market Cap Matters to Investors
Understanding market cap isn’t just a trivia exercise. It has real, practical uses for anyone building an investment strategy.
- Gauging risk and stability. Larger companies generally have more established revenue streams and can typically withstand economic downturns better than smaller ones, though size alone doesn’t guarantee safety.
- Comparing companies fairly. Stock price alone tells you almost nothing about a company’s size. A $10 stock with billions of shares outstanding can have a far larger market cap than a $500 stock with a small share count.
- Building a diversified portfolio. Many investors intentionally hold a mix of large-cap, mid-cap, and small-cap stocks to balance stability against growth potential.
- Understanding index composition. Major indexes like the S&P 500 are weighted by market cap, meaning the largest companies have a disproportionate influence on how the overall index performs.
- Spotting growth stories early. Smaller companies with strong fundamentals sometimes graduate from small-cap to mid-cap or large-cap status over time, and investors who recognize this shift early can benefit from that growth.
As The Motley Fool explains in its investor education content, market cap gives investors a straightforward way to gauge how much a company is worth relative to its peers, which makes it one of the first metrics most people learn when they start comparing stocks.
Market Cap in the Stock Market vs. Crypto
Market cap shows up outside the stock market too, most notably in cryptocurrency, and the underlying idea carries over even though the mechanics shift slightly.
In crypto, market cap is calculated as:
Crypto Market Cap = Current Coin Price × Circulating Supply
The key difference is the second variable. Instead of “shares outstanding,” crypto uses circulating supply, meaning the number of coins currently available and tradable, excluding tokens that are locked, reserved, or not yet released. This distinction matters a lot, because a coin can have a huge total supply on paper while only a small fraction actually circulates and contributes to its real market cap.
Beyond that difference, the size categories carry over in spirit. Bitcoin and Ethereum function like the mega-caps of crypto, dominating total market share and carrying outsized influence over the broader market’s sentiment. Smaller, newer tokens function more like small-cap or micro-cap stocks, offering higher potential upside alongside significantly higher risk and lower liquidity.
Common Misconceptions About Market Cap
A few misunderstandings come up often enough that they’re worth addressing directly.
Misconception: A higher stock price means a bigger company.
Not true. Price per share depends entirely on how many shares exist. A company with a $20 stock price and 10 billion shares outstanding has a far larger market cap than a company with a $2,000 stock price and 1 million shares outstanding.
Misconception: Market cap tells you if a stock is a good buy.
Market cap tells you size, not value or quality. A large-cap company can be overpriced relative to its earnings, and a small-cap company can be undervalued. Market cap needs to be considered alongside other metrics like earnings, revenue growth, and valuation ratios.
Misconception: Market cap represents money you could actually collect by selling the company.
In reality, trying to sell a large percentage of a company’s shares would move the price, often significantly, especially for smaller companies with lower trading volume. Market cap is a theoretical valuation at the current price, not a literal amount of cash sitting somewhere.
Misconception: Market cap never changes outside of price movement.
It also changes when a company issues new shares, conducts a buyback, or in crypto, when new tokens are minted or existing ones are burned.
How Beginners Should Use Market Cap in Practice
If you’re just starting to invest, here’s a practical way to put this knowledge to use:
- Check the market cap before comparing two companies, rather than relying on share price alone, which can be misleading.
- Diversify across cap sizes if your goal is a balanced portfolio, mixing the stability of large-caps with the growth potential of smaller companies.
- Use market cap as a starting filter, then dig into other fundamentals like revenue, profit margins, and debt levels before deciding.
- Watch for cap category shifts over time, since a company moving from small-cap to mid-cap or beyond can be a meaningful signal of business growth.
- Apply the same logic to crypto, remembering to check circulating supply rather than total supply when evaluating a coin’s real market cap.
Conclusion
Market cap explained simply comes down to one calculation: current price multiplied by total shares or coins in circulation, but understanding what that number actually represents takes a bit more context. It tells you the size of a company or cryptocurrency as the market currently values it, helps you sort investments into categories like large-cap, mid-cap, and small-cap, and gives you a starting point for comparing very different assets on equal footing. What it doesn’t tell you is whether something is a good investment, how much debt sits behind the number, or whether that valuation could hold up if a large number of shares or coins were sold at once. Used correctly, alongside other fundamentals, market cap becomes one of the most practical tools a beginner can learn, and one that applies just as well to a decades-old blue chip stock as it does to a cryptocurrency that launched last month.