Top Undervalued Cryptocurrencies by Market Cap: 7 Powerful Signals for Spotting Hidden Gems
Top undervalued cryptocurrencies by market cap explained through the metrics and signals analysts actually use to spot mispriced projects.

Top undervalued cryptocurrencies by market cap is a phrase that gets thrown around constantly, usually attached to a list of ten tickers and a promise that they’re about to explode. The problem is that most of those lists skip the actual work of explaining what “undervalued” means in the first place. A coin trading at a low price isn’t automatically a bargain, and a coin with a smaller market cap isn’t automatically overlooked. Plenty of cheap tokens are cheap for good reason.
This article takes a different approach. Instead of handing you a list of names to chase, it walks through the actual framework analysts and serious investors use to figure out whether a cryptocurrency’s market cap is genuinely mismatched with its fundamentals. You’ll learn how to compare market cap against fully diluted valuation, why total value locked matters for DeFi tokens, how sector rotation affects where undervaluation tends to show up, and what red flags separate a real opportunity from a coin that’s cheap because it deserves to be.
Crypto valuation isn’t as clean as traditional finance, where you can compare a stock’s price to its earnings and get a fairly direct answer. There’s no universal formula for a cryptocurrency’s “fair value.” But there are consistent signals that show up again and again across projects that later turned out to be genuinely undervalued, and this guide breaks each one down so you can apply the same thinking yourself, rather than relying on someone else’s list.
Nothing in this article is financial advice. Cryptocurrency markets are highly volatile, and any project mentioned is for illustration only, not a recommendation to buy or sell.
What “Undervalued” Actually Means in Crypto
Before looking at specific signals, it helps to define the term properly. A cryptocurrency is generally considered undervalued when its current market cap sits below what its usage, technology, adoption, or comparable projects would suggest it should be worth. In traditional finance, this concept usually means a stock trading below the discounted value of its projected future cash flows. Crypto doesn’t have cash flows in the same sense, so the equivalent signals look a little different, focusing instead on network activity, protocol revenue, comparative valuation, and adoption trends.
It’s worth being direct about something most listicles gloss over: a low market cap alone tells you almost nothing. A coin can have a small market cap because it’s a genuinely early-stage project with room to grow, or because the market has correctly priced in weak fundamentals, thin liquidity, or a failing use case. The entire skill in this space is telling those two situations apart.
Signal 1: Market Cap vs. Fully Diluted Valuation
One of the first things worth checking is the gap between a coin’s current market cap and its fully diluted valuation (FDV). Market cap reflects the value of coins currently in circulation, while FDV reflects what the value would be if every token that will ever exist were already circulating.
- A small gap between market cap and FDV generally means most of the supply is already out, so future dilution from unlocks is limited.
- A large gap means a significant portion of supply is still locked up, and as those tokens unlock, they can create ongoing sell pressure that keeps the price suppressed regardless of how strong the underlying project is.
A coin that looks cheap on market cap alone can actually be expensive once you account for the tokens still waiting to enter circulation. This is one of the most common traps in undervalued crypto research, and it’s also one of the easiest to check using data available on any major tracking platform.
Signal 2: Market Cap to TVL Ratio for DeFi Projects
For decentralized finance protocols, comparing market cap to total value locked (TVL) gives a rough sense of how the market is pricing a project relative to the actual capital flowing through it. TVL represents the total assets deposited into a protocol’s smart contracts, whether for lending, trading, staking, or other DeFi activity.
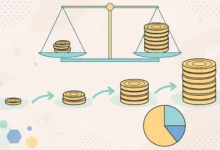

- A low market cap relative to TVL can suggest the market hasn’t fully priced in how much real usage the protocol is generating.
- A high market cap relative to TVL can suggest the token’s price is running ahead of actual adoption.
This ratio isn’t perfect, since TVL can be inflated by incentive programs or temporary yield farming activity that doesn’t reflect sustainable usage. But used alongside other signals, it’s one of the more concrete, data-driven ways to compare projects within the same sector.
Signal 3: Network Activity and On-Chain Growth
Price and market cap are lagging indicators. On-chain activity often moves first. Metrics worth tracking include:
- Active wallet growth, which shows whether real usage is expanding or stalling
- Transaction volume trends, distinguishing organic growth from short-term speculation
- Developer activity, since consistent code commits and protocol upgrades suggest a team building through market cycles rather than one that’s gone quiet
- Network fees generated, which for many blockchains functions as a rough proxy for real economic activity
When a project shows rising on-chain activity while its market cap stays flat or declines, that divergence is often what people mean when they describe a coin as undervalued. The usage is growing faster than the price is reflecting.
Signal 4: Comparative Valuation Against Sector Peers
Comparing a project’s market cap to similar projects solving the same problem is one of the more reliable ways to spot a mispricing. If two Layer 1 blockchains have comparable transaction throughput, developer activity, and ecosystem size, but one trades at a fraction of the other’s market cap, that gap deserves scrutiny.
A useful process looks like this:
- Identify the sector, whether it’s Layer 1 infrastructure, DeFi lending, oracle networks, or another category.
- List comparable projects with similar technical capabilities and target use cases.
- Compare market cap alongside adoption metrics like active users, transaction volume, and ecosystem partnerships.
- Note significant valuation gaps between projects with otherwise similar fundamentals.
- Investigate why the gap exists, since sometimes it reflects a legitimate risk factor rather than a genuine opportunity.
This comparative approach is one of the methods highlighted in CoinMarketCap’s guidance on spotting undervalued projects, which frames the exercise as identifying assets priced below their expected fair value relative to comparable projects.
Signal 5: Sector Rotation Patterns
Crypto markets tend to move in waves rather than uniformly across every coin at once. Capital typically flows through a fairly predictable sequence during a broader market upswing:
- Money enters Bitcoin first, as the most liquid and widely trusted asset
- It then rotates into Ethereum and other large-cap infrastructure tokens
- From there, it moves into established mid-cap projects with proven use cases
- Finally, it reaches smaller, higher-risk tokens further down the market cap ladder
Understanding where the market currently sits in this rotation can help explain why certain sectors look undervalued relative to others at any given moment. A sector that hasn’t yet seen its rotation, despite strong fundamentals, is often where research-driven investors focus their attention rather than chasing whatever has already run up in price.
Signal 6: Whale Accumulation and Liquidity Patterns
On-chain analytics tools make it possible to track large wallet activity, often referred to as whale accumulation. A few patterns worth watching include:
- Rising volume without a corresponding price increase, which can indicate accumulation happening quietly before a larger move
- Consistent liquidity across multiple exchanges, since coins with strong liquidity are generally easier to enter and exit without major slippage
- Concentration of holdings, since a token where a small number of wallets control most of the supply carries additional risk regardless of how undervalued it otherwise appears
None of these signals guarantee anything on their own, but combined with the fundamental checks above, they add another layer of context to whether current pricing reflects genuine market inefficiency or simply low interest.
Signal 7: Use Case Strength and Real-World Adoption
The final and arguably most important signal is whether a project actually solves a problem people are willing to pay for. This includes:
- Practical utility beyond speculation, such as payments, infrastructure, data, or financial services
- Partnerships and integrations with other protocols or real-world businesses
- Community and developer engagement, since projects with active communities tend to sustain attention through market downturns better than hype-driven tokens
- Alignment with growing narratives, such as tokenized real-world assets, decentralized infrastructure, or institutional blockchain adoption
Projects with strong fundamentals in this category but a market cap that hasn’t caught up yet are the ones most consistent with what analysts genuinely mean by “undervalued,” as opposed to coins that are simply cheap because their price has fallen and nothing else about them has changed.
Common Mistakes When Hunting for Undervalued Crypto
A few mistakes come up repeatedly among newer investors chasing undervalued opportunities.
Mistake: Assuming low price per token equals a bargain. A token priced at a fraction of a cent can still have a massive market cap if billions or trillions of units exist. Price per coin tells you nothing about valuation on its own.
Mistake: Ignoring fully diluted valuation. As covered above, a coin can look cheap on circulating market cap while carrying enormous future dilution that keeps real returns suppressed for years.
Mistake: Confusing “hasn’t pumped yet” with “undervalued.” Some coins are simply unpopular for good reason, whether due to weak technology, a stalled roadmap, or declining developer activity. Not every coin waiting for its moment is actually building toward one.
Mistake: Relying on a single metric. No individual signal, whether it’s TVL ratio, on-chain activity, or comparative valuation, is reliable in isolation. The strongest cases for undervaluation come from multiple signals pointing the same direction at once.
Mistake: Ignoring liquidity risk. A coin can look attractively priced on paper but be nearly impossible to exit in size without significantly moving the market, which matters just as much as the entry decision.
How to Build a Research Checklist
Pulling everything together, here’s a practical checklist for evaluating whether a cryptocurrency’s market cap looks genuinely mismatched with its fundamentals:
- Compare market cap to fully diluted valuation to understand future dilution risk.
- For DeFi tokens, check the market cap to TVL ratio against sector peers.
- Track on-chain activity trends, including active wallets and transaction volume.
- Run a comparative valuation against similar projects in the same sector.
- Consider where the project sits in the current sector rotation cycle.
- Look for signs of whale accumulation and confirm healthy liquidity across exchanges.
- Evaluate the strength of the project’s real-world use case and adoption trajectory.
Running a project through all seven checks won’t guarantee a good outcome, since crypto markets remain unpredictable and heavily influenced by sentiment. But it will separate genuine research from simply picking a name off a list because it’s mentioned frequently in social media discussion.
For live data to support this kind of research, platforms like CoinGecko provide market cap, FDV, TVL, and volume figures across tens of thousands of tracked projects, which makes it possible to run these comparisons directly rather than relying on secondhand summaries.
Conclusion
Finding genuinely undervalued cryptocurrencies by market cap comes down to looking past the price tag and checking whether the fundamentals actually support a higher valuation than the market is currently assigning. That means comparing market cap against fully diluted valuation, checking TVL ratios for DeFi tokens, tracking on-chain growth, running comparative analysis against sector peers, understanding where a project sits in the broader rotation cycle, watching for accumulation patterns, and honestly assessing whether the project’s use case can support long-term demand. None of these signals work reliably in isolation, and no combination of them removes the real risk involved in crypto investing. But applying this framework consistently is a far more reliable approach than chasing whatever list of tickers happens to be trending this week, and it puts the research back in your hands rather than someone else’s.