How to Track Cryptocurrency Market Cap Rankings: The Ultimate 2026 Guide
Learn how to track cryptocurrency market cap rankings accurately, avoid common mistakes, and use the right tools to follow coin rankings daily.

If you’ve spent any time around crypto, you’ve probably noticed that everyone talks about market cap like it’s the single most important number in the room. And in a lot of ways, it is. Whether you’re a beginner trying to figure out why Bitcoin sits at the top of every list or a more experienced trader watching for a coin that’s about to break into the top 50, knowing how to track cryptocurrency market cap rankings is one of the most practical skills you can build.
The problem is that a lot of guides make this sound more complicated than it needs to be. In reality, once you understand what market cap actually measures, which tools give you reliable data, and which numbers to watch alongside it, tracking rankings becomes second nature. You’ll start to notice patterns faster, spot new coins earlier, and avoid getting fooled by projects that look impressive on the surface but are built on thin trading volume or a tiny circulating supply.
This guide walks through everything step by step. We’ll cover how market cap rankings are calculated, the best platforms for tracking them in real time, the difference between large-cap, mid-cap, and small-cap coins, and the mistakes even experienced investors make when they rely on market cap alone. By the end, you’ll have a clear, repeatable process for keeping tabs on the crypto market that actually holds up over time.
What Is Cryptocurrency Market Cap and Why It Matters
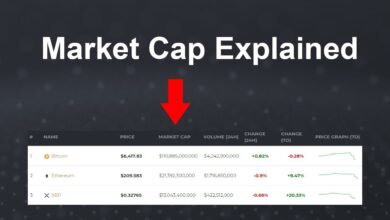
Cryptocurrency market cap (short for market capitalization) is the total value of all coins currently in circulation for a given asset. It’s calculated with a simple formula:
Market Cap = Current Price × Circulating Supply
So if a coin is trading at $2 and there are 500 million coins in circulation, its market cap is $1 billion. That number is what most exchanges and tracking sites use to rank coins from highest to lowest, which is why you’ll see Bitcoin and Ethereum consistently sitting at the top.
Market cap matters because price alone tells you almost nothing. A coin priced at $0.001 isn’t automatically “cheap,” and a coin priced at $60,000 isn’t automatically “expensive.” What actually tells you the size and relative weight of a project is its total market cap. This is why serious investors look at market cap rankings instead of raw price when comparing assets.
It also gives you a rough sense of risk. Larger market caps tend to be more stable and harder to manipulate, since it takes a lot more buying or selling pressure to move the price. Smaller market caps can swing wildly on relatively small trades, which is part of why small-cap coins are both more exciting and more dangerous for new investors.
How Market Cap Rankings Are Calculated
Every major tracking platform uses the same basic formula, but the details of how they source their data can vary slightly. Understanding this helps explain why you’ll occasionally see small differences in rankings between sites.


Circulating Supply vs Total Supply vs Max Supply
This is where a lot of confusion happens, so it’s worth breaking down clearly:
- Circulating supply is the number of coins actively available and trading in the market right now. This is the figure used in the standard market cap calculation.
- Total supply includes circulating supply plus any coins that have been mined or created but are locked, reserved, or not yet released.
- Max supply is the hard cap on how many coins will ever exist, if the project has one. Bitcoin, for example, has a max supply of 21 million.
If you only look at total supply or max supply without checking circulating supply, you can end up with a badly skewed picture of a coin’s true market cap. Some projects hold large reserves of tokens that haven’t entered circulation yet, and including those in your calculation will make the project look far bigger than it actually is in terms of active market value.
Best Tools and Websites to Track Market Cap Rankings
You don’t need to calculate any of this by hand. There are several reliable platforms built specifically for tracking cryptocurrency market cap in real time, and each has its own strengths.
CoinMarketCap
CoinMarketCap is one of the oldest and most widely used tools for checking crypto rankings. It pulls price and volume data from a large number of exchanges, then aggregates it to produce a market cap figure for each asset. You can filter by category, sort by 24-hour change, and even track historical rankings to see how a coin’s position has shifted over months or years.
CoinGecko
CoinGecko is a strong alternative that many traders prefer because of its transparency around data sourcing and its additional metrics, like developer activity and community trust scores. It’s particularly useful if you want more context beyond just price and market cap, since it factors in things like liquidity and trading pair depth.
Exchange-Based Trackers
Most major exchanges, including Binance, Kraken, and Coinbase, have their own internal market data pages. These are handy if you’re already trading on that platform, but keep in mind they typically only reflect data from that exchange, so the rankings might not match the global aggregated numbers you’d see on CoinMarketCap or CoinGecko.
Portfolio and Alert Apps
Apps like Delta, CoinStats, and Blockfolio-style trackers let you build a personalized watchlist and get notified when a coin moves up or down in the rankings. These are worth using if you’re tracking a specific set of coins rather than scanning the entire market every day.
How to Track Rankings in Real Time
Once you’ve picked a platform, the next step is building a habit around actually checking and interpreting the data. Here’s a simple process that works well for most people.
Setting Up Price and Rank Alerts
Most tracking platforms let you set alerts for specific price thresholds, percentage moves, or ranking changes. Setting these up saves you from having to manually refresh a page all day. A few useful alert types to configure:
- Rank change alerts for coins entering or leaving the top 100.
- Percentage move alerts for sudden 10%+ swings in either direction.
- Volume spike alerts to catch coins that are suddenly seeing unusual trading activity.
Using Mobile Apps for On-the-Go Tracking
If you check the market throughout the day, a mobile app is far more practical than a browser tab. Most of the major platforms mentioned above have dedicated apps that sync your watchlist across devices and send push notifications when something notable happens.
Building a Custom Watchlist
Rather than trying to track the entire market, most experienced users narrow things down to a watchlist of 20 to 50 coins they actually care about. This keeps the process manageable and helps you notice meaningful changes instead of getting lost in noise from thousands of low-volume tokens.
Understanding Market Cap Categories
Market cap rankings are typically grouped into three broad tiers, and understanding where a coin falls helps you gauge its risk profile at a glance.
- Large-cap coins (generally above $10 billion): These include Bitcoin, Ethereum, and a handful of other established projects. They tend to be more stable and are usually the first coins listed on major exchanges.
- Mid-cap coins (roughly $1 billion to $10 billion): These have proven some level of adoption but still carry more volatility than large-caps. This tier is where a lot of active trading and speculation happens.
- Small-cap coins (under $1 billion): These are the highest risk and highest potential reward category. Price swings can be extreme, and liquidity is often thin, meaning even moderate trades can move the price significantly.
Knowing which category a coin falls into before you invest gives you a much clearer sense of what kind of volatility to expect.
Common Mistakes When Tracking Market Cap
Even people who check rankings daily fall into a few recurring traps. Here are the ones worth watching for:
- Confusing price with value. A low price per coin doesn’t mean a coin is undervalued, and a high price doesn’t mean it’s overvalued. Always compare market cap, not price.
- Ignoring circulating supply changes. Some projects unlock large amounts of previously locked tokens on a schedule, which increases circulating supply and can dilute the market cap per coin even if the total valuation stays flat.
- Trusting a single data source blindly. Cross-checking a coin’s ranking across two platforms, like CoinMarketCap and CoinGecko, can help you catch discrepancies caused by delisted exchanges or stale price feeds.
- Overlooking fully diluted valuation. A coin might look small based on current market cap, but if its fully diluted valuation is many times higher, that’s a signal that a lot of future dilution is coming.
- Chasing rank jumps without context. A coin suddenly climbing 50 spots in the rankings might be genuine growth, or it might be a temporary volume spike or even coordinated trading. Always dig a little deeper before acting.
Advanced Metrics to Watch Alongside Market Cap
Market cap is a great starting point, but relying on it alone leaves gaps. Pairing it with a few additional metrics gives you a much more complete picture.
Trading Volume
Trading volume tells you how much of a coin is actually being bought and sold over a given period, usually 24 hours. A coin with a large market cap but very low volume can be difficult to buy or sell without affecting the price. Comparing volume to market cap (sometimes called the volume-to-market-cap ratio) is a useful way to spot coins with weak liquidity.
Fully Diluted Valuation (FDV)
Fully diluted valuation estimates what a coin’s market cap would be if the entire max supply were in circulation right now. Comparing current market cap to FDV can reveal how much dilution risk exists. A coin trading at $500 million market cap with a $5 billion FDV has a lot of future supply that could eventually hit the market.
Market Dominance
Market dominance shows what percentage of the total crypto market a single coin represents. Bitcoin dominance, for example, is a widely tracked figure because shifts in it often signal broader trends, like capital rotating into or out of altcoins.
How to Use Market Cap Rankings for Investment Decisions
Tracking rankings isn’t just an academic exercise. It has real, practical uses if you’re actively investing or trading.
- Diversification planning: Spreading investments across large-cap, mid-cap, and small-cap coins can balance stability with growth potential.
- Spotting emerging trends: When a specific sector, like layer-2 networks or decentralized infrastructure tokens, starts climbing the rankings as a group, it often signals where market attention is shifting.
- Risk assessment: A coin’s tier tells you a lot about expected volatility, which should directly inform position sizing.
- Timing entries and exits: Watching how a coin’s rank has trended over the past few months, rather than just its current position, can help you avoid buying into a short-term spike.
None of this replaces proper research into a project’s fundamentals, team, and use case, but market cap rankings give you a fast, standardized way to compare thousands of assets at a glance before digging deeper into the ones that catch your interest.
Conclusion
Tracking cryptocurrency market cap rankings doesn’t need to be complicated once you understand what the number actually represents and where to find reliable data. Start with a trusted platform like CoinMarketCap or CoinGecko, build a watchlist of coins you actually care about, and pair market cap with supporting metrics like trading volume, fully diluted valuation, and market dominance so you’re not making decisions based on one number alone. Whether you’re just getting familiar with the crypto market or refining a more active trading strategy, a consistent tracking routine will help you spot real opportunities faster and avoid the common mistakes that trip up less careful investors.